|
Previously, I plotted all the routes during a 24 hr span by Car2go customers in Austin. While it shows each individual route and its origin and destination, many of them were covered by the last plotted route if they share the same road. As a result, the plot does not show a lot of information (it is colorful though). Today, I modified the code a little bit to uncover the most popular road by Car2go customers. I dropped color = name in geom_path(), but grouped the routes by each car so that routes by different cars are not linked. I added alpha = 0.1 for transparency. This way, the road will show its popularity based on the color transparency, i.e. road with solid color is more popular than those with transparent color. 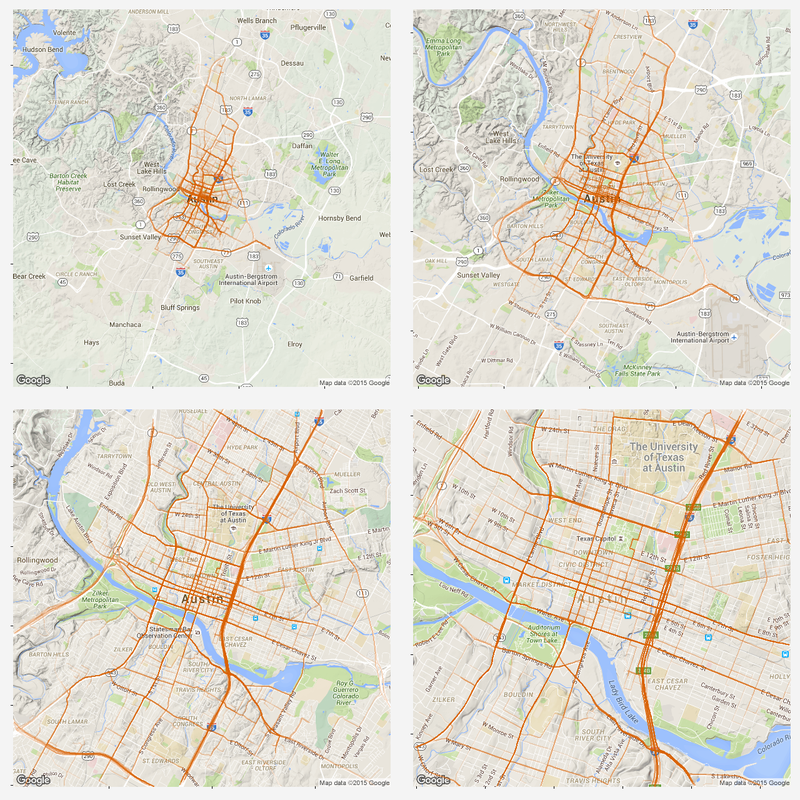 As we can see, MoPac Expy, Interstate 35, Hwy 290 and roads in downtown are most popular. Amongst downtown streets, east and west bound roads (number streets) are more popular than south and north bound roads, as interstate 35 and Lamar Blvd take majority of east-west traffic. Another reason might be that south and north bound roads are narrower and have more stop signs.
As why this color to represent the routes... Once again, all the codes are published here.
1 Comment
|
AuthorA mechanical engineer who also loves data. Archives
January 2018
CategoriesBlogs I enjoy reading |
 RSS Feed
