For ongoing project, please go to my blog page.
My github
Charge Transport in Semiconductor
One of my research topics is the coupled charge transport in semiconductor. My work helps researchers understand the interaction between phonons (the energy carrier) and electrons (or holes, the charge carrier). This is especially important for Seebeck effect, which is the driving force for thermoelectric energy conversion.
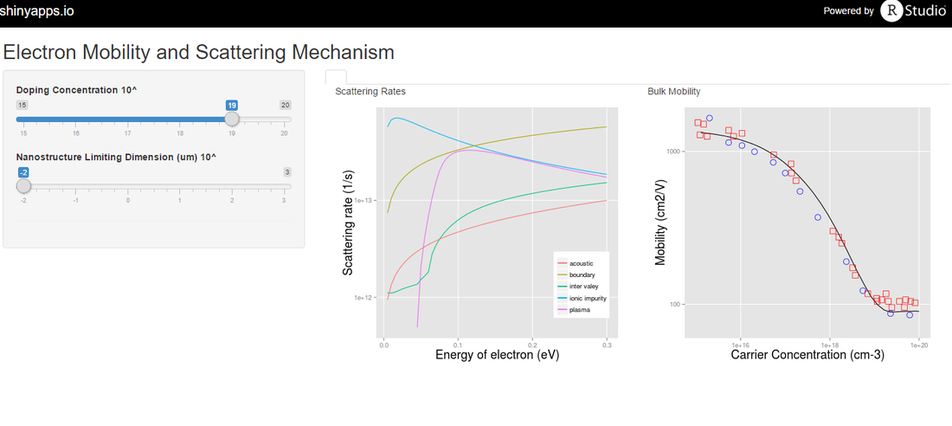
I developed the following app (also hosted on shinyapps.io) to visualize the interplay between different scattering mechanisms in the left plot. The user can choose between different doping levels and the smallest dimension in the nanostrcture. It is insightful to watch boundary scattering becomes less important at higher doping levels. The right plot compares my model and measured data. It is worth noting that the curve is not merely a fitting for the data (as most online resources), but derived from BTE with detailed scattering events (which are shown on the left). This plot does not render real time, as it will take a lot of computation power.
The model and results were partly published here and here.
*The project was initially implemented in Matlab, and re-written in R later.
#illini twitter feed
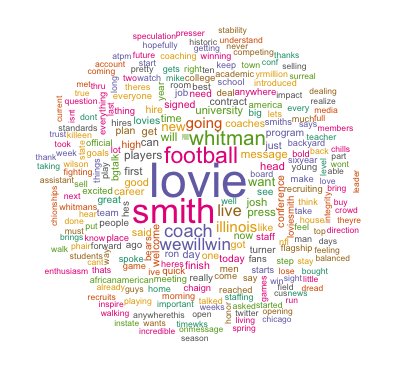
Word cloud within one hour after Lovie Smith was introduced in press conference as Illinois head football coach.
NBA Stat in Tableau
The same data I used for my NBA shiny app are now displayed using Tableau. I made it such that it most resembles my shiny app.
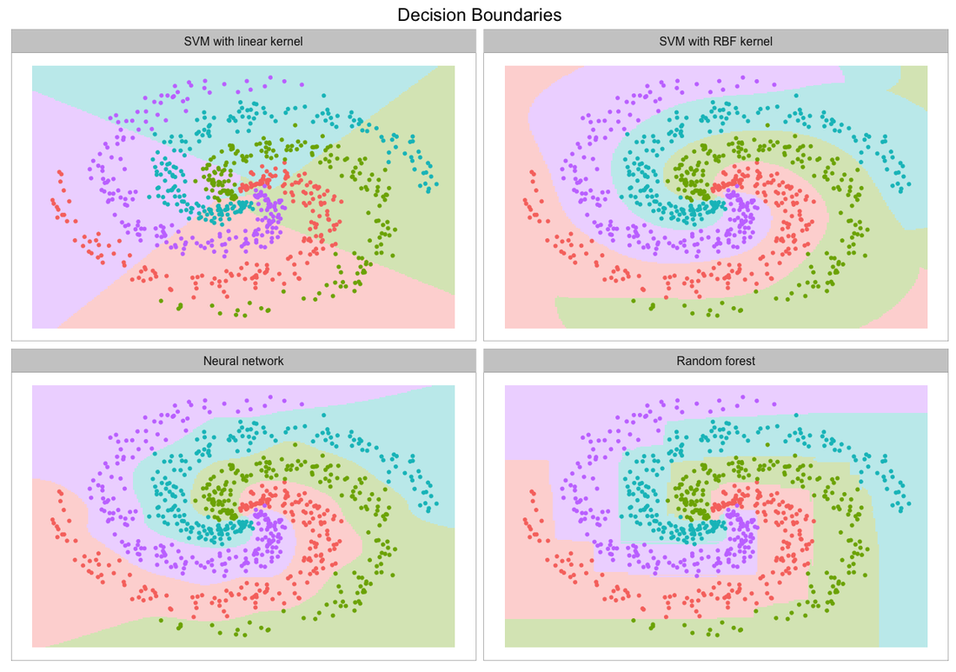
Visualization of ML Decision Boundaries
Visualize the decision boundaries of 'SVM with linear kernel', 'SVM with RBF kernel', 'Neural network', 'Random forest' on a spiral data set. The code is published on my github. This is a follow-up of my previous post 'Build Your Own Neural Network in R'.
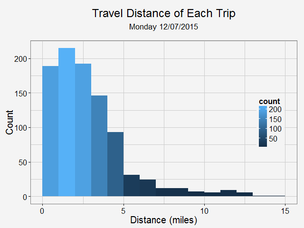
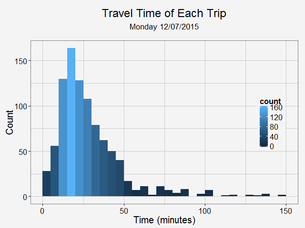
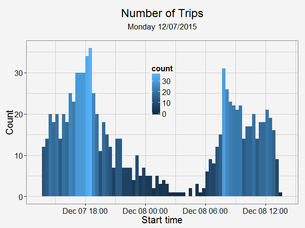
Car2go Trips in Austin
Visualize car2go activities in Austin. For details on how to scrape data, construct route info and generate those figures, please go to my blog post 1, 2 and 3.
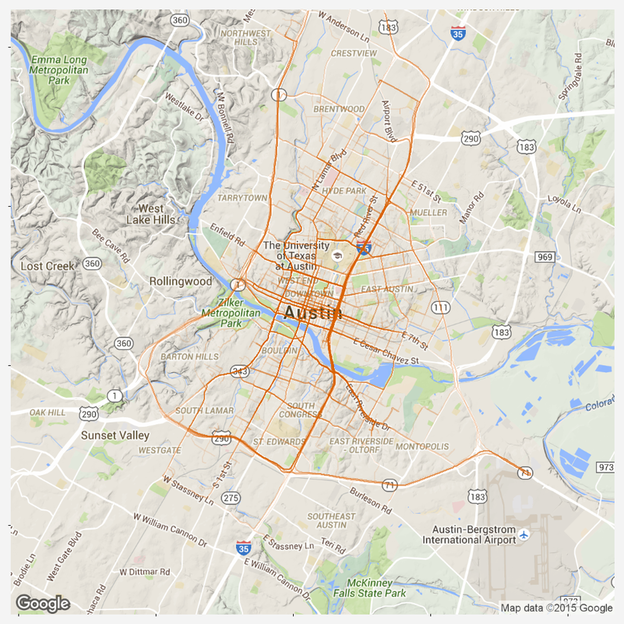
Popular routes visualized by the Burnt Orange color
|
|
NBA Stat in a Shiny App
For detailed analysis, how to scrape data and construct the app, please go to my blog page.
